'The BI Survey 7' Details Purchase Practices, Ranks Loyalty by Brand'The BI Survey 7' Details Purchase Practices, Ranks Loyalty by Brand
In the successor to "The OLAP Survey 6," Nigel Pendse delivers exhaustive customer survey findings on business intelligence vendor effectiveness and customer deployment success rates.

Delivering what is undoubtedly the most in-depth, survey-based report available on the business intelligence market, Nigel Pendse and the Business Application Research Center (BARC) will next week release "The BI Survey 7." The successor to Pendse's popular "OLAP Survey" series, The BI Survey 7 explores vendor and product selection, deployment success, cost of ownership and customer loyalty. The latest survey includes a wider array of products extending beyond OLAP (thus the name change), and it also drops product reviews and qualitative product comparisons in favor of what the publisher describes as deeper and more detailed quantitative analyses.
Billed by BARC as "the largest, most thorough, fact-based analysis of the growing BI market," The BI Survey 7 tops 400 pages and incorporates some 250 charts and figures — the table of contents alone is 13 pages long. The findings are based on analyses of the experience of more than 2,700 respondents, with more than 1,900 completing detailed questions about BI product usage. Participants are from all over the world, with 53 percent hailing from Europe, 37 percent from North America and the remainder from the rest of the world (led by Australia and Japan, respectively).
Taking a sneak peek at key results (gleaned from a preview copy of the survey shared with Intelligent Enterprise and other media partners), the survey details BI purchasing and deployment best practices. Consistent with prior OLAP Survey findings, the new survey finds that buyer selection criteria are out of sync with business benefits gained. And in one of the report's most closely watched metrics, vendor loyalty measures are even more polarized this year, with Microstrategy, Applix TM1 (now owned by Cognos) and Microsoft Analysis Services scoring better than in previous years while Oracle/Hyperion Essbase and SAP BI/BW continued a trend toward declining loyalty.
The Purchase Cycle

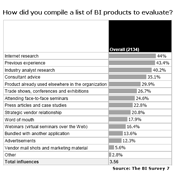
Candidate Product Selection
(click image for larger view)
How do most companies go about selecting BI software and how satisfied are they? The BI Survey 7 dedicates an entire 32-page chapter to this topic. It starts with Internet research, respondents report, followed by previous experience, industry analyst research and consultant advice, in that order of frequency (see "Candidate Product Selection" chart at right). Customer sites spending large amounts on software license fees were "more influenced than average" by industry analyst research, existing deployments and strategic vendor relationships, and "less influenced than average" by Internet research, seminars and webinars, and advertisements, the survey finds.
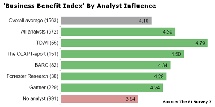
In what some might consider a self-serving line of analysis, the survey maps the influence and effectiveness of analyst research, including that of the OLAP Report and BARC, the publisher of The BI Survey 7. Organizations that use industry analyst research achieve more "business benefits" than those that do not, according to the report. This is measured by the survey's "Business Benefit Index" (BBI), a weighted, aggregate score of nine attributes ranging from "faster or more accurate reporting" and "improved customer satisfaction" to savings on headcount and reduced IT cost.

BBI by Analyst Influence
(click image for larger view)
While Gartner was deemed "the most influential" industry analyst, cited by 38 percent of those who used analyst research (favored particularly in North American), organizations that relied on Gartner are said to gain the lowest level of business benefit. Those following The OLAP Report and BARC research (favored in Europe) are said to gain the second and third highest business benefit levels, respectively, while organizations following TDWI (The Data Warehousing Institute) research are said to benefit the most (see "Business Benefit Index by Analyst Influence" chart at right).
Interestingly, Gartner followers are more likely than average respondents to select Business Objects, Cognos, Hyperion and MicroStrategy solutions, whereas those favoring The OLAP Survey were are likely than average to select Microsoft, Panorama, ProClarity (now Microsoft) or Applix TM1 (now part of Cognos).
Isn't an OLAP Survey/BI Survey respondent more likely to report favorably on the very same research? Nigel Pendse tells Intelligent Enterprise that "most of the participants were not BARC/OLAP Report customers. [Respondents] were more likely to have been invited to participate by a publication or a vendor."
Consistent with past OLAP Survey reports, and a key point of best-practice advice, the survey finds that companies conducting multi-product evaluations are "more likely to achieve their business goals, and much more likely to realize business benefits than those that did not. This may be partly because they were more likely to have selected the most suitable product, and partly because their projects were more thorough in other ways, too."
Selection Criteria and Deployment Success
Benefits-Driven Selection Criteria |
Following in the footsteps of the OLAP Survey, The BI Survey 7 uncovers a disconnect between selection criteria reported by respondents and how products should be selected based on the survey's Business Benefits Index. To wit, the primary reasons respondents cite for selecting products are functionality (41 percent) and ease of use for end users. In contrast, a ranking of criteria based on project success, as measured by BBI, places three product-related criteria at the top of the list: "range of server platforms supported" (last among survey respondent criteria), "fast performance," and "ease of use for application builders" (see "Benefits-Driven Ranking of Selection Criteria," at right).
This result "confirms that all too many organizations are allowing corporate factors to get in the way of successful BI projects," the survey concludes. "Successful projects were based on choosing the tool rather than the vendor."
Even if many companies are choosing products for the wrong reasons, satisfaction with BI investments remains high, according to the survey, with 71 percent of respondents saying their projects have "largely or completely met their business goals." In contrast, only 8 percent say project goals have not been met at all.
Nearly 90 percent of those already using BI see a need to deploy solutions more widely, and current usage levels are shockingly low, with only 8.7 percent of employees within the typical organization making regular use of BI applications. What's holding things back? The survey details a long list of deployment obstacles headed by:
1. Cost of Software (24%)
2. Slow query performance (20.2%)
3. Cost of implementation/support (19.4%)
4. Slow data load/build/calculate times (16.2%)
5. Administration complexity (16%)
As in prior OLAP Survey studies, "slow query performance was the most widespread technical problem… and this seems to be becoming more common as time passes," The BI Survey 7 concludes. "Projects that used query performance as an explicit evaluation criterion tended to be more successful than those that did not." Further, the survey found that "the faster the query performance, the more business benefits are reported and the more likely it is that business goals will be achieved."
Vendor Effectiveness and Customer Loyalty
The BI Survey 7's 53-page "Vendor Effectiveness" chapter covers marketing and sales effectiveness, win rates and trends, deployed seats and "shelfware" by vendor, quality of support and future buying intentions. Perhaps the most closely followed rankings of all — at least based on the history of The OLAP Survey series — are loyalty rates, which are often quoted by top-scoring vendors.
The survey defines a loyal customer as one who will:
-- Continue to use existing applications
-- Purchase additional software to deploy existing applications more widely
-- Use the product in preference to others when implementing new/ rewritten apps
-- Favor the product if there is ever a requirement to reduce the number of BI suppliers.
Product Loyalty League |
By these measures and based on feedback from more than 1,900 respondents, the survey finds that three products leading the "loyalty league" table in 2006 — MicroStrategy, Applix TM1 (now part of Cognos) and Microsoft Analysis Services — increased their loyalty scores in 2007. Among the top 11 vendors ranked in the survey (see "Product Loyalty League" at right), Hyperion Essbase (now an Oracle product) and SAP BI/BW "continued their trend of declining loyalty in 2007, and Cognos Analysis also suffered a sharp drop," the survey finds. "In the past, Oracle BI customers have also shown declining loyalty; this was manifested in 2007 by a dearth of Oracle BI customers."
The publication of The BI Survey 7 will no doubt cause a stir in the industry over the next few weeks. With the survey's purchase price set at $4,995 for three users, any debate is likely to be among industry insiders and large organizations with fat research budgets (though we'll attempt to share the substance of ongoing debate via our blogs).
Can Survey respondents be considered unbiased given that vendors help drive respondents to the survey? "There is a risk of using vendors to rope in more participants," Pendse tells Intelligent Enterprise. "We do ask them to issue the invitation as part of a general newsletter rather than in targeted mailings, and we also check the data very carefully on a case-by-case basis, rejecting any dubious data."
While small, one-product vendors are likely to have regular, personal contact with customers, Pendse notes, larger vendors are less likely to have personal contacts and, thus, a mechanism to sway survey participants, he reasons.
"In general, it seems that users don't feel loved by the big vendors, and often don't get good results from their BI products, but corporate pressure stops them abandoning products that may be very disappointing," says Pendse. "Some probably do use the survey as a way of venting their frustration, but I see no harm in capturing such data, which would be carefully excluded from a vendor-sponsored survey."
About the Author
You May Also Like


