BI Scorecard: OLAP 2BI Scorecard: OLAP 2
Architecture is the most important criterion when evaluating OLAP functionality. Our series continues with a look at six leading products.

If you've been following this series of reviews of BI products, you may have noticed that I've been discussing analysis capabilities in increasing order of complexity. In the Reporting segment, I examined interactive reports, which allow drilling into detail. In the next segment of the series, I looked at spreadsheet integration, which provides more flexibility and is one of the most popular tools for analysis. A spreadsheet can take analysis just so far, however; for more robust analysis you need online analytic processing (OLAP).
Who Needs OLAP?
Some analysts say that OLAP is appropriate for only a small percentage of users, primarily power users. I disagree.
On the BI user spectrum, "information consumer" is the least analytic and is the polar opposite of power user. When it comes to my energy bill, for example, I qualify as an information consumer.
After moving back to northern New Jersey during the coldest winter in 30 years, I positively flipped when I got one gas bill. My first question was, "What was my bill last month?" My gas provider had intuitively already provided a comparison chart including the prior month. Time period comparisons like this are characteristic of OLAP. So my next question was, "What was it last year?" For this, I had to dig through paper files, when OLAP could have given me the answer in a single click.
There is, actually, an alternative to OLAP for this type of user. As I discussed in the "Reporting" segment of this series (see Resources), the ability to link multiple reports is one way of delivering drill down, a key OLAP capability. However, providing linked reports that can drill into one another assumes the report designer can predict a user's thought process. While this prediction is sometimes possible, it's clearly not always possible. Full OLAP functionality lets the user choose drill paths, and it encompasses more than just drilling.
Bottom line: I think all users — from intermittent information consumers to power users — would benefit from various aspects of OLAP functionality. Unfortunately, OLAP architectures and cost often prohibit broad access.
OLAP vs. Reporting
In the early 1990s, Essbase (then owned by Arbor but now property of Hyperion) was a bit of an anomaly. So Arbor hired the father of relational databases, E. F. Codd, to clarify this new thing called OLAP. Codd defined 12 rules (see Resources), but the following four most differentiate reporting from OLAP (see Table 1):
1. Multidimensional: Users analyze numerical values from different dimensions, such as product, time, and geography. A report, on the other hand, may be one dimensional, such as list of product prices at one point in time.
2. Consistently fast: As users navigate different dimensions and levels within a dimension, OLAP means fast — the speed of thought. If a user double-clicks to drill down from Year to Quarter, waiting 24 minutes or 24 hours for an answer isn't acceptable. Report users, of course, don't want slow reports either, but indeed, some reports take this long to run and must be scheduled.
3. Varying levels of aggregation: To ensure predictable query times, OLAP vendors preaggregate data in different ways. Reporting, to the contrary, can be at the lowest level of detail: Rather than sales by product, you might have individual line items for a particular order number.
4. Cross-dimensional calculations: With multiple dimensions come more complex calculations. In OLAP, you might want to analyze percentage contribution or market share. These analyses require subtotaling sales for a particular state then calculating percentage contribution for the total region, country, or world. Users may analyze this percentage market share by a number of other dimensions, such as actual vs. budget, this year vs. last year, or for a particular group of products. These calculations often must be performed in a particular order and involve input numbers that users might never see. Detailed reports, however, often rely on simple subtotals or calculations of values that are displayed on the report itself.

TABLE 1 The contrasting characteristics between reporting and OLAP.
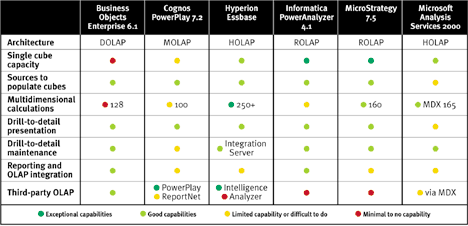
Bear in mind that just because we make a distinction between reporting and OLAP doesn't mean users want their analysis tools to be distinct from their reporting tools. OLAP users want to create reports from multidimensional data and, conversely, report consumers want all the traffic-light displays and highly visual analysis that once was reserved for OLAP. Vendors have been battling for years about how to satisfy these diverse needs. As you select one or more BI tools, your job is to understand what you need most: OLAP, reporting, or both. When the answer is both, evaluate reporting and OLAP integration carefully. As shown in the scorecard, Table 2, OLAP and reporting integration has a way to go.
OLAP Architectures
When selecting an OLAP tool, the OLAP architecture is the single most important criterion to understand: It affects many other individual features and your ability to deploy the system. People have recently declared the MOLAP-ROLAP-DOLAP debate dead. (That's multidimensional, relational, and desktop or dynamic, respectively.) To me, as long as the vendors still take these different approaches, the arguments are alive and kicking (perhaps screaming).

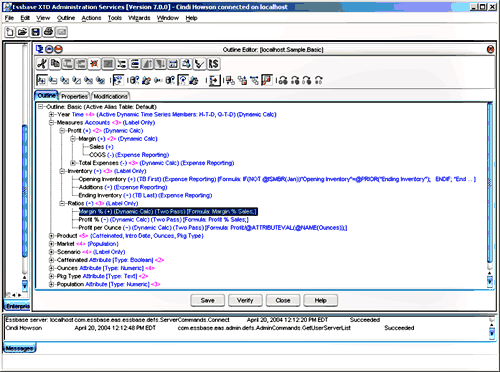
FIGURE 1 Hyperion Essbase presents complex consolidations and multidimensional calculations in simple language.
MOLAP uses a persistent cube structure, separate from the relational database. Hyperion Essbase, Microsoft Analysis Services, and Cognos PowerPlay all use MOLAP approaches. Because the cubes involve a subset of data that is precalculated, the response times are fast and predictable compared to DOLAP and ROLAP. MOLAP databases also traditionally have a greater degree of multidimensional calculations that are easier to implement than in ROLAP. For example, Hyperion Essbase uses a function @DESCENDANTS that lets you refer to members within a particular level in a hierarchy. (January, February, and March are descendants of Quarter1.) Although some relational databases have a CASE function that may let you refer to these rows within a calculation, not all do — and a calculation will not be straightforward. (See Figure 1.)
When evaluating these capabilities, consider how similar calculations (such as market share) are implemented: Do they require lines of code? Can you control calculation order? Are they precalculated and cached, or calculated at query time? The huge downside with MOLAP is that it is another data store for IT to support, administer, and maintain. It's not uncommon for companies to complain about the effort of maintaining 200 cubes or to have a poorly designed cube that takes a week to recalculate. When a dimension changes, such as adding a new product or reorganizing business units, it might force you to recalculate an entire MOLAP cube.
Relational OLAP, conversely, uses relational tables to deliver multidimensional analysis. Within the products reviewed here, MicroStrategy and Informatica are the main ROLAP players. SAP BW with its InfoCubes also uses a ROLAP approach.
MicroStrategy uses partitions and aggregate tables within the RDBMS to deliver fast queries. To accomplish complex OLAP calculations, it uses a combination of multipass SQL and temporary tables.
ROLAP tools won't have the limits of a single cube, but they can be plagued by slow response time. If your company lacks the technical DBA skills to tune a database well, a user drill down can result in a 25-minute query. Historically, a drill down in MicroStrategy always hit the underlying relational tables. With MicroStrategy's OLAP Services, a drill down may access a cache, quelling the arguments that ROLAP is inherently slower than MOLAP.
Many MOLAP vendors use a combination of ROLAP and MOLAP, an approach referred to as hybrid OLAP (HOLAP). Microsoft Analysis Services, for example, can use a ROLAP architecture to accommodate larger data volumes. Hyperion Essbase can also store larger dimensions in relational tables. The response time, like with other ROLAP tools, is slower than using strictly MOLAP storage so most implementations continue to use MOLAP storage to guarantee fast analysis.
DOLAP has historically stood for desktop OLAP, as much of the processing was done on a user's desktop. I refer to it as dynamic OLAP to reflect how micro cubes are built dynamically — perhaps on the desktop but more often on a midtier application server.
Unlike with MOLAP, IT doesn't build a large cube in advance. Instead, the cubes are dynamically built when a user runs a query. The data volumes and multidimensional calculations within a cube are limited compared to MOLAP and ROLAP (although the queried sources can be gigabytes in size). The cubes are more aptly referred to as personal cubes.
The main benefit to DOLAP is flexibility and maintenance: Cubes don't need to be built in advance, unlike with MOLAP. If your company adds a new product or reorganizes departments, these changes are reflected automatically when you refresh a query.
At the same time, DOLAP tools suffer from all the risk of RDBMS performance that ROLAP tools do. With more OLAP capabilities being built into RDBMSs such as IBM's DB2 Cube Views or Oracle 9i OLAP's Analytic Workspace, DOLAP vendors rely on RDBMS vendors as well as MOLAP vendors to address performance and complex calculation issues. For example, leading RDBMS vendors now have a RANK function, allowing server-based rankings that weren't previously possible with DOLAP. Even when your RDBMS has analytic capabilities, it's not guaranteed that the DOLAP vendor supports it.
Of the products covered in this review, Business Objects is the leading DOLAP vendor. In version 9, Crystal Ad Hoc had DOLAP capabilities that were removed in version 10 as Web-based interactive capabilities were given a higher priority. While I've given Business Objects a red score for multidimensional calculations, this score is for the microcube itself. The company has made a strategic decision to use the calculation engines within MOLAP and RDBMS databases as much as possible. Hyperion Intelligence, formerly Brio, also uses a DOLAP architecture.
Drill to Detail
As I stated earlier, the OLAP approach affects many individual features, such as drill through to detail. When you analyze summary data such as sales by product, you may continue to drill down to a point (perhaps to individual sales orders) in which that data is no longer in the MOLAP or DOLAP cube. Drill to detail is a capability that must exist in both the OLAP platform and in the user interface. Within the OLAP platform, the cube must somehow be mapped to the underlying relational sources that were originally used to populate the summary cubes. Within the user interface, when you double click to drill down, you shouldn't have to be aware that you're drilling from a cube into a relational source.
While most of the products here do well in mapping MOLAP sources to relational sources, the approach and effort in defining and maintaining those mappings is variable. Furthermore, the user experience ranges from seamless, elegant reports to meaningless dumps of full star schemas. For ROLAP tools, both the summary and detail exist in relational tables, so this criterion isn't applicable. (See Table 2 for product scores.)

TABLE 2 Scorecard comparing OLAP features in several BI suites.
Sources to Populate Cubes
Because of their ability to extract data from multiple data sources, MOLAP tools are often successfully used as a data mart platform. Data marts are clearly not ideal for an enterprise information architecture. Instead, data from multiple data sources is best loaded into a central data warehouse that can then be used to populate a MOLAP cube. With a data warehouse architecture, MOLAP cubes benefit from faster cube builds. In reality, though, some companies don't have the capabilities and funding to build a data warehouse. When you don't, then the ability to populate a cube from multiple flat files and databases is a criterion to consider.
For Business Objects' microcube, one cube can be populated from multiple queries, stored procedures, XML files, and spreadsheets — as I explained in the Query segment of this series. (See Resources.) Cognos PowerCubes and Hyperion Essbase cubes can be populated from multiple data sources.
Microsoft Analysis Services cubes can also be populated from multiple data sources when the cube is partitioned, a capability of the Enterprise Edition. If the granularity and dimensionality are different between the fact tables, then you would use virtual cubes. For example, a sales schema may have daily sales and a customer dimension; an inventory schema may have end-of-month values and use a warehouse dimension. Users can still analyze sales and inventory together when an administrator builds two physical cubes and presents the common dimensions as one virtual cube. The next release, codenamed "Yukon" and due mid 2005, promises to support normalized schemas as well.
Here again, multiple data sources create less of an issue for ROLAP vendors: A relational database clearly can be populated from multiple data sources. However, you still must consider the types of schemas supported within the relational environment (normalized, star, or snowflake).
Analysis and Reporting Integration
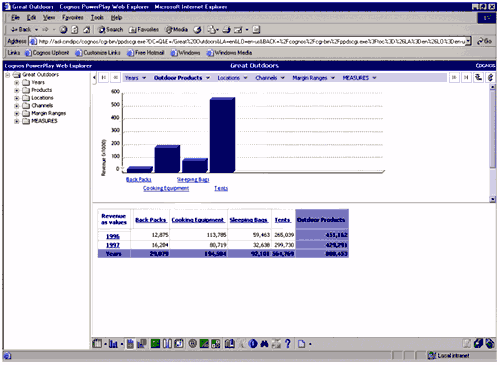
OLAP front ends have some different requirements from standard reporting. Traffic light displays in which, for example, good sales numbers appear in green and bad in red, are one of the features that add to the "sexiness" of OLAP front ends. Synchronized drilling between a chart and table is key. (See Figure 2.) When you're drilling up and down a hierarchy or pivoting different dimensions, you easily can get lost. The best OLAP front ends make the navigation easy.

FIGURE 2 Cognos PowerPlay Web provides synchronized drilling in charts and tables. Many analysis functions are available via an easy toolbar.
After a certain point in analyzing the data, you'll want to create a report that captures your findings. All of the OLAP vendors reviewed here offer reporting capabilities. However, that doesn't necessarily mean they all offer one user interface or a unified architecture. Business Objects as a DOLAP tool has tight reporting and analysis integration. However, when used to access a MOLAP source such as Essbase or Microsoft Analysis services, the Web-based user interface is quite different and lacks reporting capabilities (unlike the BusinessObjects desktop product). Similarly, the Crystal Reports interface for production reporting differs from the Crystal Analysis front end to MOLAP cubes.
Cognos's flagship product has historically been PowerPlay. It can access Essbase and Analysis Services cubes, yet its new ReportNet product (for query and reporting) can currently access only SAP BW Info Cubes.
Hyperion has long had two distinct products: Hyperion Reports for OLAP-based financial reporting and Hyperion Analyzer for OLAP analysis. With its newly acquired Brio product line, the former Brio products have been rebranded as Hyperion Intelligence (DOLAP) and Hyperion SQR for production, relational reporting. Hyperion Intelligence, then, provides a third way to access OLAP data for analysis and management reports. Throughout the year, Hyperion plans to provide further integration among these products.
Microsoft's new Reporting Services can theoretically create a report from an Analysis Services cube, although the report author must write custom MDX. For analysis, though, Microsoft relies on other partners such as ProClarity and Panorama to provide the OLAP interface, in addition to the BI suite vendors reviewed here.
Additional Features
This segment of the BI Scorecard highlights just a few of the OLAP architectures and features you must consider when selecting or standardizing on a BI tool. For an administrator, the ease of designing, building, and tuning the OLAP platform is critical. For end users, capabilities such as attribute analysis, write access for what-if analysis, traffic light displays, and time-period analysis are also important.
Next Focus: Administration
You've provided users with a full range of query, reporting, scheduling, spreadsheet, and analysis capabilities. It's now up to IT to administer the BI application. Fail to consider these criteria, and you'll have a sexy application that easily breaks. In the next installment of this series, I'll cover administration concerns.
Cindi Howson is the president of ASK, a BI consultancy. She coteaches The Data Warehouse Institute's "Evaluating BI Toolsets" and is the author of Business Objects: The Complete Reference (McGraw-Hill Osborne Media, 2003).
Resources |
|---|
Dr. E. F. Codd's 12 Rules for OLAP: Earlier installments online at Intelligent Enterprise.com: Related product reviews available online at IntelligentEnterprise.com: |
A Word about Product Inclusion |
|---|
Throughout this BI Scorecard Series, I've focused on six product suites, based primarily on overall market share or mind share. Omission of certain vendors is not a reflection of product capabilities but merely scope management: Evaluating products hands-on lets me give you an apples-to-apples comparison, but it unfortunately forces me to minimize the number of products evaluated. I've included Hyperion Essbase in this segment based on its OLAP market leadership. However, when I began these in-depth evaluations a year ago, the financial viability of Brio was uncertain. Following the acquisition by Hyperion, the product direction was initially unclear. Hyperion recently published its integration roadmap, and I can now say the rebranded products will be strong competitors in the query and reporting markets. |
Robert Eisenberg, principal of RE Associates, consults, speaks, and writes on business process management and service-oriented architecture. He has owned two software companies, sold one, and held a senior IT position at a public corporation.
About the Author
You May Also Like


