Cool BI: Rating the Latest InnovationsCool BI: Rating the Latest Innovations
Rich, interactive reporting interfaces, in-memory analytics and social networking may be cool, but how much value do they add to business intelligence. This article examines the maturity, value and mainstream appeal of leading innovations.

For those who thought last year's industry consolidation meant boring business intelligence (BI), think again. Vendors large and small are continuing to innovate at a rapid pace, often faster than customers can respond. In this article, I offer a framework for evaluating innovations and highlight three that are highest on my radar: rich interfaces, in-memory analytics, and social networking.
Figuring Out What Matters
Some BI innovations are simply cool and make the BI interface more appealing. Others make BI smarter and more actionable. With new technologies, the key is figuring out which innovations will bring the most value with minimal technical challenges. To evaluate these innovations and prioritize BI investments and upgrades, think about them in terms of maturity, value, and pervasiveness (MVP):
Maturity: Consider the technology's maturity, particularly in its integration with BI. Some innovations have been making inroads into BI for years, whereas others are more recent introductions. If the industry doesn't yet agree on standards, early adopters will face greater deployment challenges. Yet when innovation brings significant value to a business, early adopters gain a competitive, first-mover advantage. Consider whether your company has a culture of being "bleeding edge" or "leading edge."
Value: Consider the value of the innovation, to either reduce BI's cost of ownership, improve productivity or increase BI's contribution to business performance. Some BI deployments focus on the value of a single, big decision. At these companies, BI is often deployed first to the experts and analysts. Other firms look for improvement on all the little decisions that may have a small individual impact yet a huge aggregate contribution to results. Some innovations may have a high dollar value per insight, as is the case when a predictive analytic spots fraud or reduces customer churn. Innovations like embedded BI may help increase sales, yet only in aggregate when all front-line workers can leverage the technology. In addition to the value an innovation brings to the decisions supported by BI, new deployment models such as Software as a Service (SaaS) and open source are driving down costs and, with SaaS in particular, implementation time.

Which Innovations Impact Which Users
(click image for larger view)
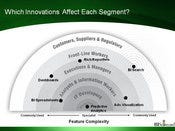
Pervasiveness: Though many vendors have trumpeted the rallying cry for "mainstream BI" or "pervasive BI," BI adoption even among established practitioners is relatively low at 25 percent of employees within the company. In evaluating innovations, recognize that each will appeal to different user segments as illustrated in the chart at right. Advanced visualization, for example, is powerful for business analysts, whereas BI search is ideal for casual users and embedded BI helps front-line workers. Mobile BI has big potential for executives and front-line workers, but the business analysts who are currently the largest BI constituency may say it's not at all important. Innovations that make BI more pervasive are not necessarily more important than those that benefit power users; the point is to recognize that different user segments will benefit more from certain innovations.

Evaluating BI Innovations
(click image for larger view)
The quadrant chart at right positions several BI innovations according to these three factors. Maturity is along the X axis, pervasiveness is along the Y axis, and the size and color of the bubble indicates the financial value. 'Rich Reportlets': The Flashy Side of BI
The term "rich reportlets" refers to the influence of rich Internet applications (RIA) in the BI world. Think of a static, green-bar-paper-based report. Now compare that to these highly interactive, Web-based rich reportlets from Business Objects (Crystal Xcelsius) and MicroStrategy (Dynamic Dashboards). Bubbles and trend lines dancing across a page may not seem essential to BI techies, but ask business users which tool they'd rather use and they'll vote for a rich reportlet. When you are trying to change the way people work, don't underestimate the power of the "cool" factor in getting them to try new tools.
Beyond the appeal of these interfaces, rich reportlets contribute substance to BI. For example, users can sort, filter and change the display of any item via simple mouse clicks, without having to learn or launch a sophisticated design environment or go back to IT to have the report modified. Used effectively, animation can call attention to important data points (although to date, most vendors seem to be using Adobe's Flash RIA technology primarily for its user appeal). Another benefit of many rich reportlets is that you can store the underlying data as well as the presentation in a single file (HTML or SWF), reviving disconnected analytics capabilities that many products lost in the move to Web-based BI.
Rich reportlets rely on one or both of the following technologies:
Ajax (Asynchronous Java Script and XML)
Adobe Flash and Flex
It seems the BI industry has not yet cast its final vote on which of these technologies will win out, although Flash currently has the most traction. Among large vendors, Business Objects has had a jumpstart on the use of Flash, primarily through Xcelsius. MicroStrategy supported both Flash and Ajax in its 2007 release of Dynamic Enterprise Dashboards. Oracle supports Flash in its BI Publisher and will add it to its Answers product in a release due out next year. Information Builders was an early innovator with its Active Reports, which use Ajax, and the company released a Flash version this quarter. Cognos plans to release new dashboarding capabilities this quarter that leverage Flash.
Meanwhile, Microsoft recently released SilverLight, a competitor to Adobe Flash. Although none of the major BI vendors yet supports SilverLight (including Microsoft BI products), it's something companies need to watch.
Proponents of Ajax tout its smaller network footprint and browser independence. Proponents of Flash claim a richer experience. Regardless of which technology the BI vendor supports, I continue to see big differences in how the technologies are used, both in the design process and in the finished dashboards or reports. In Business Objects Xcelsius, for example, a developer builds a model and saves it to a Flash (SWF) file that can then be embedded in anything from a PowerPoint presentation to a Crystal Report to a portal. MicroStrategy users build a Flash-based dashboard in the same Report Services design tool used to develop formatted reports. Niche vendor eThority, meanwhile, uses Flash extensively not only in the finished dashboard or report, but throughout the product's user interface.
Bottom line: Embrace rich reportlets and interfaces for their capability to make BI engaging to existing users and more appealing to new classes of users.
In-Memory Analytics
In-memory analytics has been around for years, so why the recent buzz? The answer lies in a combination of:
Increasing adoption of 64-bit operating systems and greater availability of addressable memory
Lower costs for RAM (random access memory)
How in-memory analytics are used and delivered
Shifts in user expectations for speed-of-thought analysis
Traditional 32-bit operating systems have only 4 GB of addressable memory. Once a BI server loads the operating system, application logic and user meta data, there isn't a lot of memory left over for data. In contrast, 64-bit operating systems support 256 GB of RAM and up to 1 TB of virtual memory. Today, 64 GB of RAM can cost $13,000, compared to $64,000 a few years ago. Think about the size of your data warehouse or data marts and just how much of that data could theoretically be loaded into RAM! The advent of 64-bit not only means you can cram more sophisticated applications with more users and greater concurrency onto a single server, it also has a profound impact on in-memory analysis of data. In-memory means super fast — a million times faster than accessing the same data from a disk.
This advance sounds like a dream come true, but there are some constraints in that the hardware, the operating system, and the BI tools first have to support 64-bit architectures natively. For example, 64-bit Windows was released only three years ago. Database vendors haven't been terribly aggressive about developing in-memory analytics, with Oracle acquiring Times Ten in 2005, IBM acquiring SolidDB early this year and Microsoft announcing Project Gemini for 2010. Not surprisingly, the more data-intensive and enterprise-scale BI vendors, such as SAS, Hyperion Essbase, Information Builders and MicroStrategy, were early supporters of 64-bit architecture. SAP released its combination in-memory and BI appliance solution, the Business Intelligence Accelerator (BIA), in 2006. However, Business Objects only just released native support for 64-bit in its 3.1 release, and Cognos 8.4 contains only partial support for 64-bit. Beyond the BI platform vendors, other early supporters of 64-bit architecture include IBM Cognos TM1 (acquired from Applix in 2007), QlikTech and TIBCO Spotfire, all of which load data into memory for fast analysis.
Though it helps in-memory tools be more scalable, 64-bit architecture is not required. Regardless of the platform, in-memory analytics are compelling because they can be as agile as the business demands and can help move BI beyond basic data access to faster insight. In IBM Cognos TM1, users can change hierarchies on the fly; so if a business is contemplating reorganization, for example, all those new aggregations can be quickly processed in-memory. TM1 write-back capabilities allow for fast, what-if analysis. With traditional OLAP tools, an IT person would have to redesign and rebuild the cube, often in a batch job run overnight.
In-memory tools certainly faced scalability issues with 32-bit OSs in the past, but these concerns become less of a problem on 64-bit platforms. The move to 64-bit partially explains the rapid growth of in-memory vendor QlikTech, which has grown about 80 percent per year over the last few years compared to the BI market overall, which has grown about 10 percent per year. QlikTech differentiates itself as using "associative" OLAP, which does not require data to be hierarchical and thus has power beyond drilling up and down (a more detailed review is available at BIScorecard.com). Users can select the desired information, and non-relevant information is automatically grayed out. This is a subtle but big difference compared to traditional query and OLAP tools. Notice in this example that all countries and all products appear as possible filters. Once Germany is selected, for example, only products that sell in that country (such as wheels) appear as valid filters, whereas products that don't sell in Germany (such as headsets) appear dimmed. With most BI tools, only a subset of the data is ever displayed and users are forced to iteratively select, query and review sometimes invalid combinations of filters. By having all the data in-memory and displayed in this associative way, the analysis is more visual and can be executed at the speed of thought.

Spotfire screen shot.
(click image for larger view)
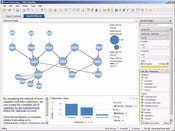
Advanced visualization vendors such as SAS JMP, TIBCO Spotfire, Advizor Solutions, and Tableau Software have long had the approach of loading data into memory (check this free report on where these tools fit). In-memory makes them fast and iterative, but their differentiator is in how the information is displayed and selected. All the BI platform vendors support standard charts, but these vendors support a range of advanced visualizations such as heat maps, spark lines, small multiples, and bullet graphs. Such visualizations pack more information into a smaller display as a way of facilitating insight. Instead of users having to pose a question and wait for an answer with traditional query and OLAP tools, advanced visualization tools automatically present the data in a way that more quickly reveals patterns and anomalies. The sample screenshot at right from TIBCO Spotfire shows a new network analytic to reveal relationships between food suppliers, shippers and packers to help identify possible problems in the food supply chain. Users interact with and filter the data via simple sliders and check boxes on the right, or they can lasso certain packers.
In-memory BI tools have their drawbacks though, most notably in the initial build process and in that they are less Web-enabled as core BI modules.
Bottom Line: Users were once happy to get a weekly report. Today, the pace of business demands fast data access and even faster insight. The 64-bit architecture provides greater scalability to in-memory tools, and it is gaining greater adoption and support.
Web 2.0 Meets BI
Public debates about abound how useful or wasteful the social networking aspects of the Web 2.0 movement have been. I've been slow to embrace social networking myself; if it doesn't have a business value, it's not on my radar. Is social networking only cool, or is it also useful to BI?
The collaborative side of the Web is so prevalent and accepted by a new generation of workers that we have to contemplate the effects on BI. I'll suggest that social networking could solve some of BI's greatest challenges:
Information overload
Information hoarding
Providing insights to the most appropriate people to decrease the time to decision
Sure, there are plenty of useless blogs, wikis and postings out there. But in a business context, these tools can help. For starters, users are drowning in information. Data warehouses have grown 5 to 50 fold in the last three years. So many reports, dashboards and spreadsheets are out there that getting to the right data is increasingly a challenge. Social networking capabilities like report ranking can help battle information overload. Ranking mechanisms provide a useful way for people to identify the most relevant and used reports.

Antivia Screen shot
(click image for larger view)
Several large BI vendors are adding these capabilities and a few customers have developed their own solutions. Startup vendor Antivia provides ranking and collaboration capabilities for third-party BI platforms including Business Objects and Microsoft Reporting Services and SharePoint. Support for Cognos, Pentaho, and Oracle are forthcoming. As the Antivia screen shot at right shows, users' rankings are specific to their role (what's important to a marketing person may be different than what stands out to an accountant). Beyond user-based rankings, Antivia also provides smart recommendations (think Amazon-like product suggestions) in addition to most-popular reports based on roles and usage statistics. Antivia also supports discussions, capturing insights and actions in a centralized way.
Collaboration can extend beyond corporate boundaries; this is where start-up Swivel comes into play. Swivel shares similarities with YouTube, except instead of videos users post data sets and charts. The company also recently launched a Swivel for business that lets organizations upload private data sets and take advantage of the site's collaborative features.
Social networking is a primary theme of Web 2.0, but mashups deserve a mention here, too. Any user suffering from IT's backlog of report and enhancement requests would like to be less dependent on this department. Mashups are a step in the right direction. Mashups offer BI developers a faster way of combining data and displays from multiple sources. A popular example is a Google Maps mashup in which internal data, such as revenue by country, is displayed in a geographic map. Prior to this lightweight integration approach, the BI vendor or the IT department would have to buy, load and integrate mapping software. With mashups, developers can easily hook into APIs offered by the likes of Google and other publishers.

WebFocus Google Mashup
(click image for larger view)
Among the leading BI vendors, Information Builders was one of the first to offer an elegant integration of Google Maps. Released in March, WebFOCUS Google Maps lets a report developer choose Google Maps from a drop-down menu (as shown in the screen shot at right). The developer then specifies how the data is geocoded (by zip code, longitude and latitude).
Bottom Line: Some of social networking's influence on BI certainly has a high "cool" factor, but the business value is not yet proven. Nonetheless, the potential to extend the reach of BI, reduce information overload and give users greater autonomy make this an important area to watch.
Beyond Cool, What's Useful?
In this article, I've highlighted a few innovations that are generating the most buzz and that seem to have high value. Some are more mature than others. A few other innovations are worth noting:
Open-Source BI: Given the lower price point (a tenth to a third of commercial licensing fees) of open source, customers looking to expand their deployments to a broader base are contemplating open source as a complement to their commercial BI standards. Vendors to consider include Pentaho, JasperSoft, Actuate BIRT and Spago BI.
Software as a Service: With a tight economy and limited IT resources, SaaS solutions offer departments and smaller companies a way to get into BI quickly, with pay-as-you-go pricing. Vendors to consider include Business Objects CrystalReports.com, Pivot Link and Success Metrics Birst. For industry-focused solutions, consider Oco and LucidEra.
BI Search: If users like the simplicity of Google, they will like BI Search. Several BI vendors have integrated search-based query into their platforms, though with limited customer adoption. Two products worth noting are Business Objects Polestar and Progress EasyAsk.
Mobile BI: Few users may be demanding this capability, but I suspect that's because it appeals mainly to traveling executives and field workers who may not realize what's available. All leading BI vendors support mobile BI but not necessarily on the same smartphones or with the same ease of navigation and data exploration capabilities.
Predictive Analytics: This mature capability continues to remain a specialist tool and task. Encompassing predictive analytics within a total BI deployment means more people can benefit from predictive discoveries and insights, which is both a strategic issue and a technical one. With SAS and Teradata closely partnering and SPSS striking deals with Business Objects and Cognos, the convergence of BI and predictive analytics continues to gain momentum.
About the Author
You May Also Like


