San Diego Taps Big Data To Optimize TransitSan Diego Taps Big Data To Optimize Transit
San Diego Metropolitan Transit System studies bus and trolley ridership patterns using Urban Insights' predictive analysis platform.


Government Data + Maps: 10 Great Examples
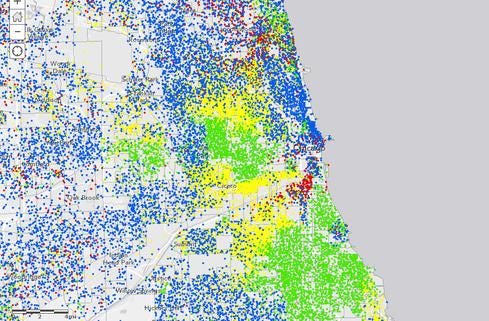
Government Data + Maps: 10 Great Examples (Click image for larger view and slideshow.)
Data variety, data complexity, and sheer data volume have all come together in a data-driven transit optimization project underway in San Diego.
The San Diego Metropolitan Transit System (MTS) is suffering from a classic case of information overload. The agency has disparate data sources, including a smart-card payment system, GPS-based automatic vehicle location devices on buses, automatic passenger counters on trolleys, and extensive route and schedule information formatted in the general transit feed specification (GTFS) format developed by Google in 2006.
"We look at all these data sources independently, and they help us improve performance, but we haven't been able to make correlations among the various data sources," said Sharon Cooney, MTS chief of staff, in an interview with information.
[Want more on geospatial analysis? Read Urban Observatory Maps Comparisons Between Cities.]
Late last year, MTS turned to Urban Insights, a big-data services unit of Cubic Transportation Systems (the agency's supplier of smart-card and revenue management software), to make better use of its data. The problem encountered in San Diego -- disparate data sources -- is all too common in transportation projects, so Urban Insights has developed a cloud-based analytics modeling platform built on Hadoop.
"MTS wanted not just a one-off study of transit usage but a reusable process of integrating data sources and producing insights so planners can determine when travelers are not using the network as anticipated," said Wade Rosado, Urban Insights' director of analytics. "We have to align and make sense of the data to unravel the mystery of how people are using the system."
In some cities smart cards are used when entering and leaving the transit system, but analysis in San Diego is complicated by the fact that the trolley system operates on a barrierless honor system, whereby passengers are expected to tap their smart cards on fare validators as they enter the platform. Fare collection on buses is controlled by the driver, but there's no connection to vehicle locators to show how many riders boarded at which stop. Both factors make it difficult to track where people start and end their journey and where they transfer from route to route or from trolleys to buses.
Urban Insights and MTS got a start on blended, big data analysis in January by analyzing tapping patterns at the trolley platforms -- meaning the level of ridership versus trolley fare validation. The analysis began with the GTFS data on when specific trolleys are expected to arrive where on a route. To this they correlated the trolley-platform validation data. But this only captured the number of passengers on specific routes and trolleys who tapped their smart cards. To get a complete picture of ridership, Urban Insights added data from the automatic passenger counters, which is time stamped, and correlated it with the GTFS scheduling data.
"Now we can see how many boarded versus how many tapped," said Cooney. "The only other way we could do that previously was through handheld units that officers use to spot-check who tapped and who didn't, but that's only a small sampling of overall system usage."
This initial insight could obviously be used to put officers on the right platforms at the right times to curb fare beaters, but the bigger prize for MTS is deeper study of ridership patterns. The agency recently redesigned its trolley routes so that the Green line serves Old Town, the San Diego Convention Center, and the Petco Ballpark, while the Blue Line stops at the city's Amtrak station rather than continuing to Old Town.
"We need to understand how those changes impact riders and whether it made our system more attractive," said Cooney.
Urban Insights and MTS are currently at work on aligning and correlating all available data to study how these route changes have impacted various point-to-point travel times, transfer points, ridership levels, and, with added customer survey data, overall rider satisfaction levels.
"It takes a lot of computing power, memory, and storage, and we're doing it over a three-month period looking at half a million transactions per day," Rosado explains.
The outputs include blended data sets, reports, and sophisticated geospatial visualizations (as shown in the image above). These maps show the quantity of transfers made at particular locations with different size rings. Services offered are depicted by shapes, with sizes and colors indicating different attributes of those services. The visualizations will help MTS determine where and whether transfer activity is inconsistent with the service levels offered.
"Understanding the behaviors and needs of customers is our first job," said Cooney. "We try to use as many tools as we can to provide a sustainable system, and we're hopeful this is one more tool we'll be able to use."
information's new Must Reads is a compendium of our best recent coverage of the Internet of Things. Find out the way in which an aging workforce will drive progress on the Internet of Things, why the IoT isn't as scary as some folks seem to think, how connected machines will change the supply chain, and more. (Free registration required.)
About the Author
You May Also Like


